
Although it remains a common practice within treasury, managing cash forecasts in Excel often does more harm than good. This is because spreadsheets lack security, validation, and auditability. They also have little to no ability to extend forecast horizons. And finally, building a cash forecast with spreadsheets takes significant time and effort – and the ensuing data is often outdated by the time the process is complete. The below blog explores these points in more detail.
When speaking with treasury practitioners, it’s clear that one of the most commonly used tools for managing cash forecasts is Microsoft Excel.
Whether you work at a mid-sized company or one of the Fortune 500, chances are that Excel spreadsheets are part of your daily life. This is true despite widespread innovation in financial software, as many practitioners prefer the familiarity and customization that Excel affords. As a result, Excel remains a go-to tool for managing the cash forecasting process within many organizations today.
But just how well do spreadsheets perform in this role?
In many cases, the answer is “not well”.
Excel Lacks Security, Validation, & Auditability
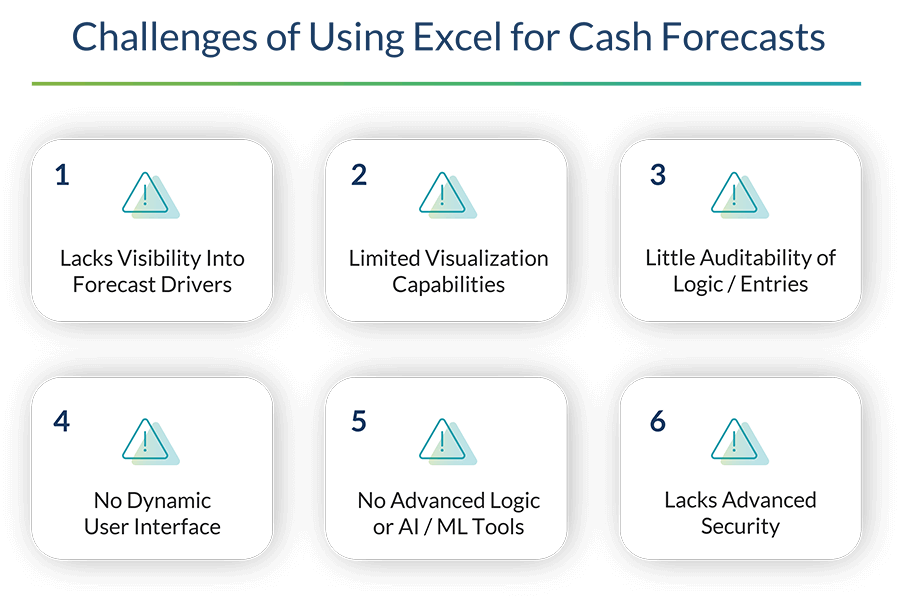
Although the issues with spreadsheets are numerous, the most pressing concerns can be summarized as follows: no security (beyond a basic password), no validation, and no auditability.
If you are responsible for putting the cash forecast together, you can add a few more items to the list:
- Lack of visibility into forecast drivers.
- No dynamic user interface.
- Limited visualizations.
- No business logic, Artificial intelligence (AI) or Machine Learning (ML).
There are also a few more subtle issues to consider when forecasting using Excel. For example, there is little to no ability to extend the horizon of your forecast. There’s also the time and effort it takes to build the forecast on a regular basis.
Let’s unwrap some of these issues in more detail.
Spreadsheets & Excel Gurus Have Their Limits
If your cash flow projection covers today to the end of the week, you may be able to get by using spreadsheets. But if, like most treasury teams, you want to have visibility and accuracy out to 90 days (or beyond), you simply can’t achieve this using Excel. The reason is simple: spreadsheets are not designed to scale up with the volume of data required to build a one-to-three month forecast.
Summarizing this data in order to see trends and analysis is simply too large a task for spreadsheets. And the harder you try – with multiple sheets, Excel models, macros and pivot tables – the higher the risk when your “guru” decides to leave the company, taking their knowledge of your complicated spreadsheet with them.
Another issue is that spreadsheets cannot scale outward in time, which is needed if you want to manage a rolling forecast whereby items roll on and off, based on invoice dates. All you can do is put a limited snapshot of data into a spreadsheet and get limited decision-making results back – and even that requires an enormous amount of time and effort.
The lean treasury teams we speak to often spend hours every month simply putting the basic forecast together.
Looking up data in the systems, running reports to Excel, and copying and pasting into what ultimately becomes a behemoth of a spreadsheet – with its attendant errors and utter lack of history – is a laborious, time-consuming, and ultimately disappointing experience.
We spoke with one treasury manager whose process is to copy and paste data from 130 spreadsheets into a single master file in order to begin putting the forecast together. The process takes three days, and the information is often outdated by the time this process is completed.
We spoke with one treasury manager whose process is to copy and paste data from 130 spreadsheets into a single master file in order to begin putting the forecast together. The process takes three days, and the information is often outdated by the time this process is completed. Imagine what this person could do if they started with a complete set of forecast data?
How to Avoid a Disappointing Cash Forecasting Experience
To benefit from a strategic-level cash forecast, you need a purpose-built tool. In particular, you need a tool that is market tested, and designed with a razor-sharp understanding of how users want to collect and analyze their forecast data.
A tool that consolidates all your source data can elevate your forecast in several key ways. For example, it can:
- Add logic to make the forecast more realistic.
- Provide workflows to support your business units and entities.
- Support scenario and variance analysis, which puts you at the starting line of the race, instead of a mile back.
Spreadsheets, in contrast, are a blank slate with no real integration or topical analytics. They will never get you to your goal of providing senior management with the visibility, accuracy, and scenario analysis they need to make meaningful decisions – so using them comes with an opportunity cost to your liquidity and working capital. In other words, spreadsheets are not just unhelpful; they may actually be hurting your forecast.
Luckily there are tools available that can equip your treasury team with the insights they need to fulfil their strategic goals – such as the TIS Cash Forecasting solution.
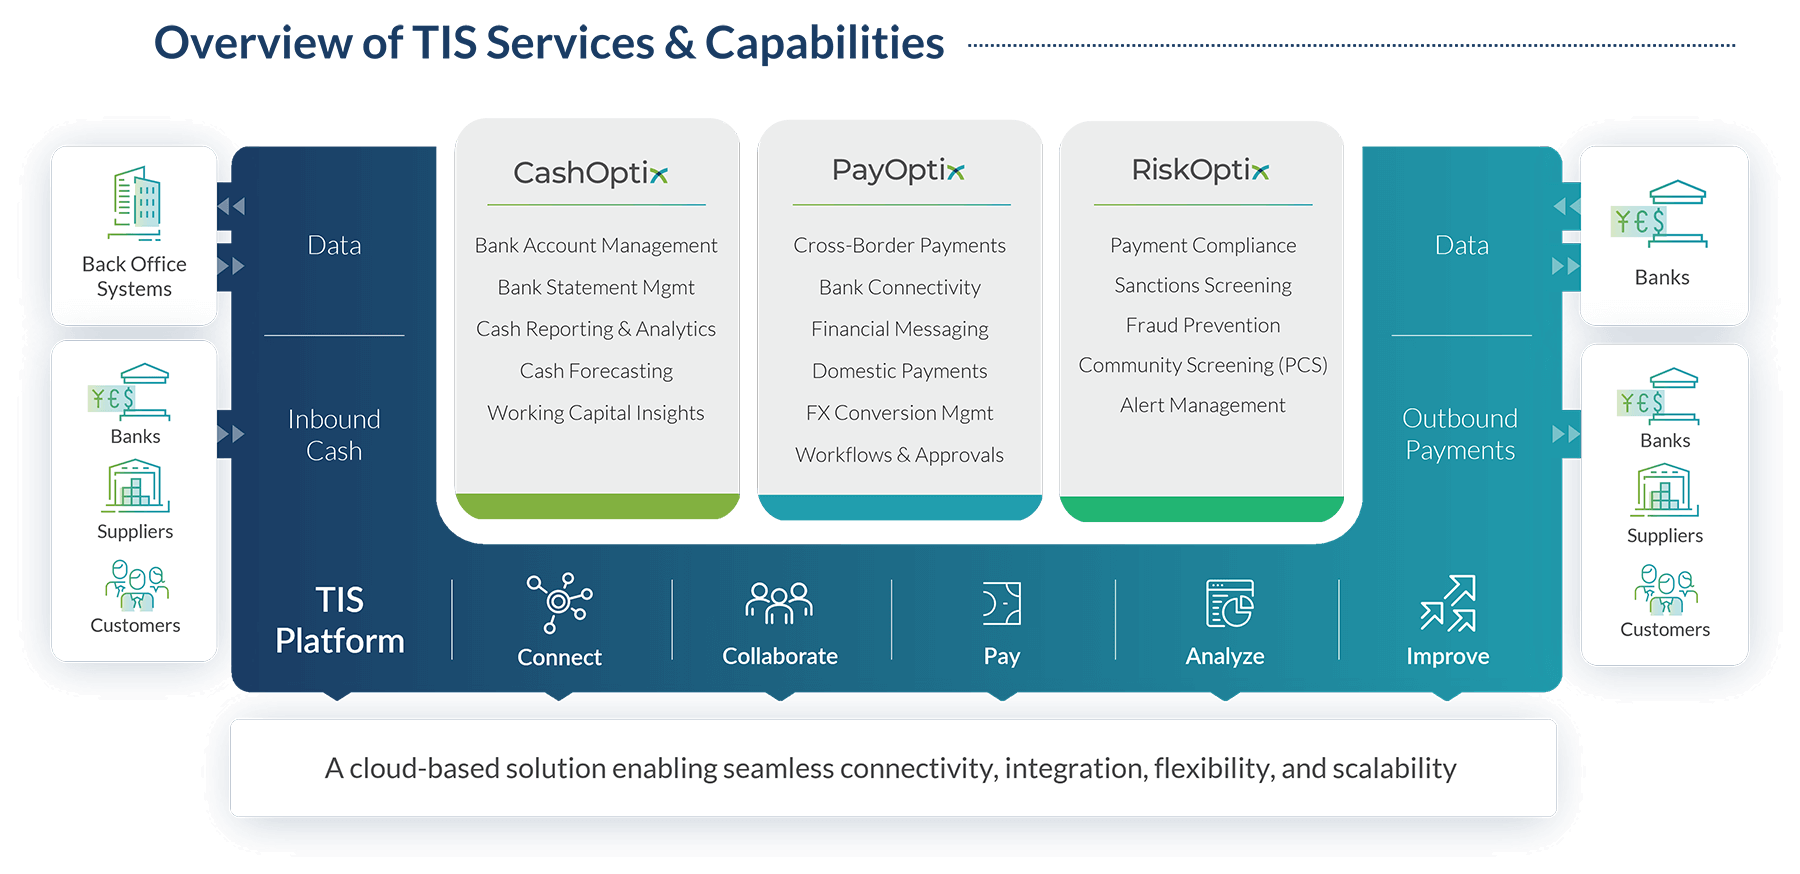
How TIS Helps with Cash Forecasting
Earlier in 2022, TIS acquired Cashforce, an AI-powered cash management and forecasting solution provider. As a result, TIS now provides our enterprise clients with an advanced suite of forecasting capabilities that can revolutionize the speed, accuracy, and efficiency through which the process is managed.
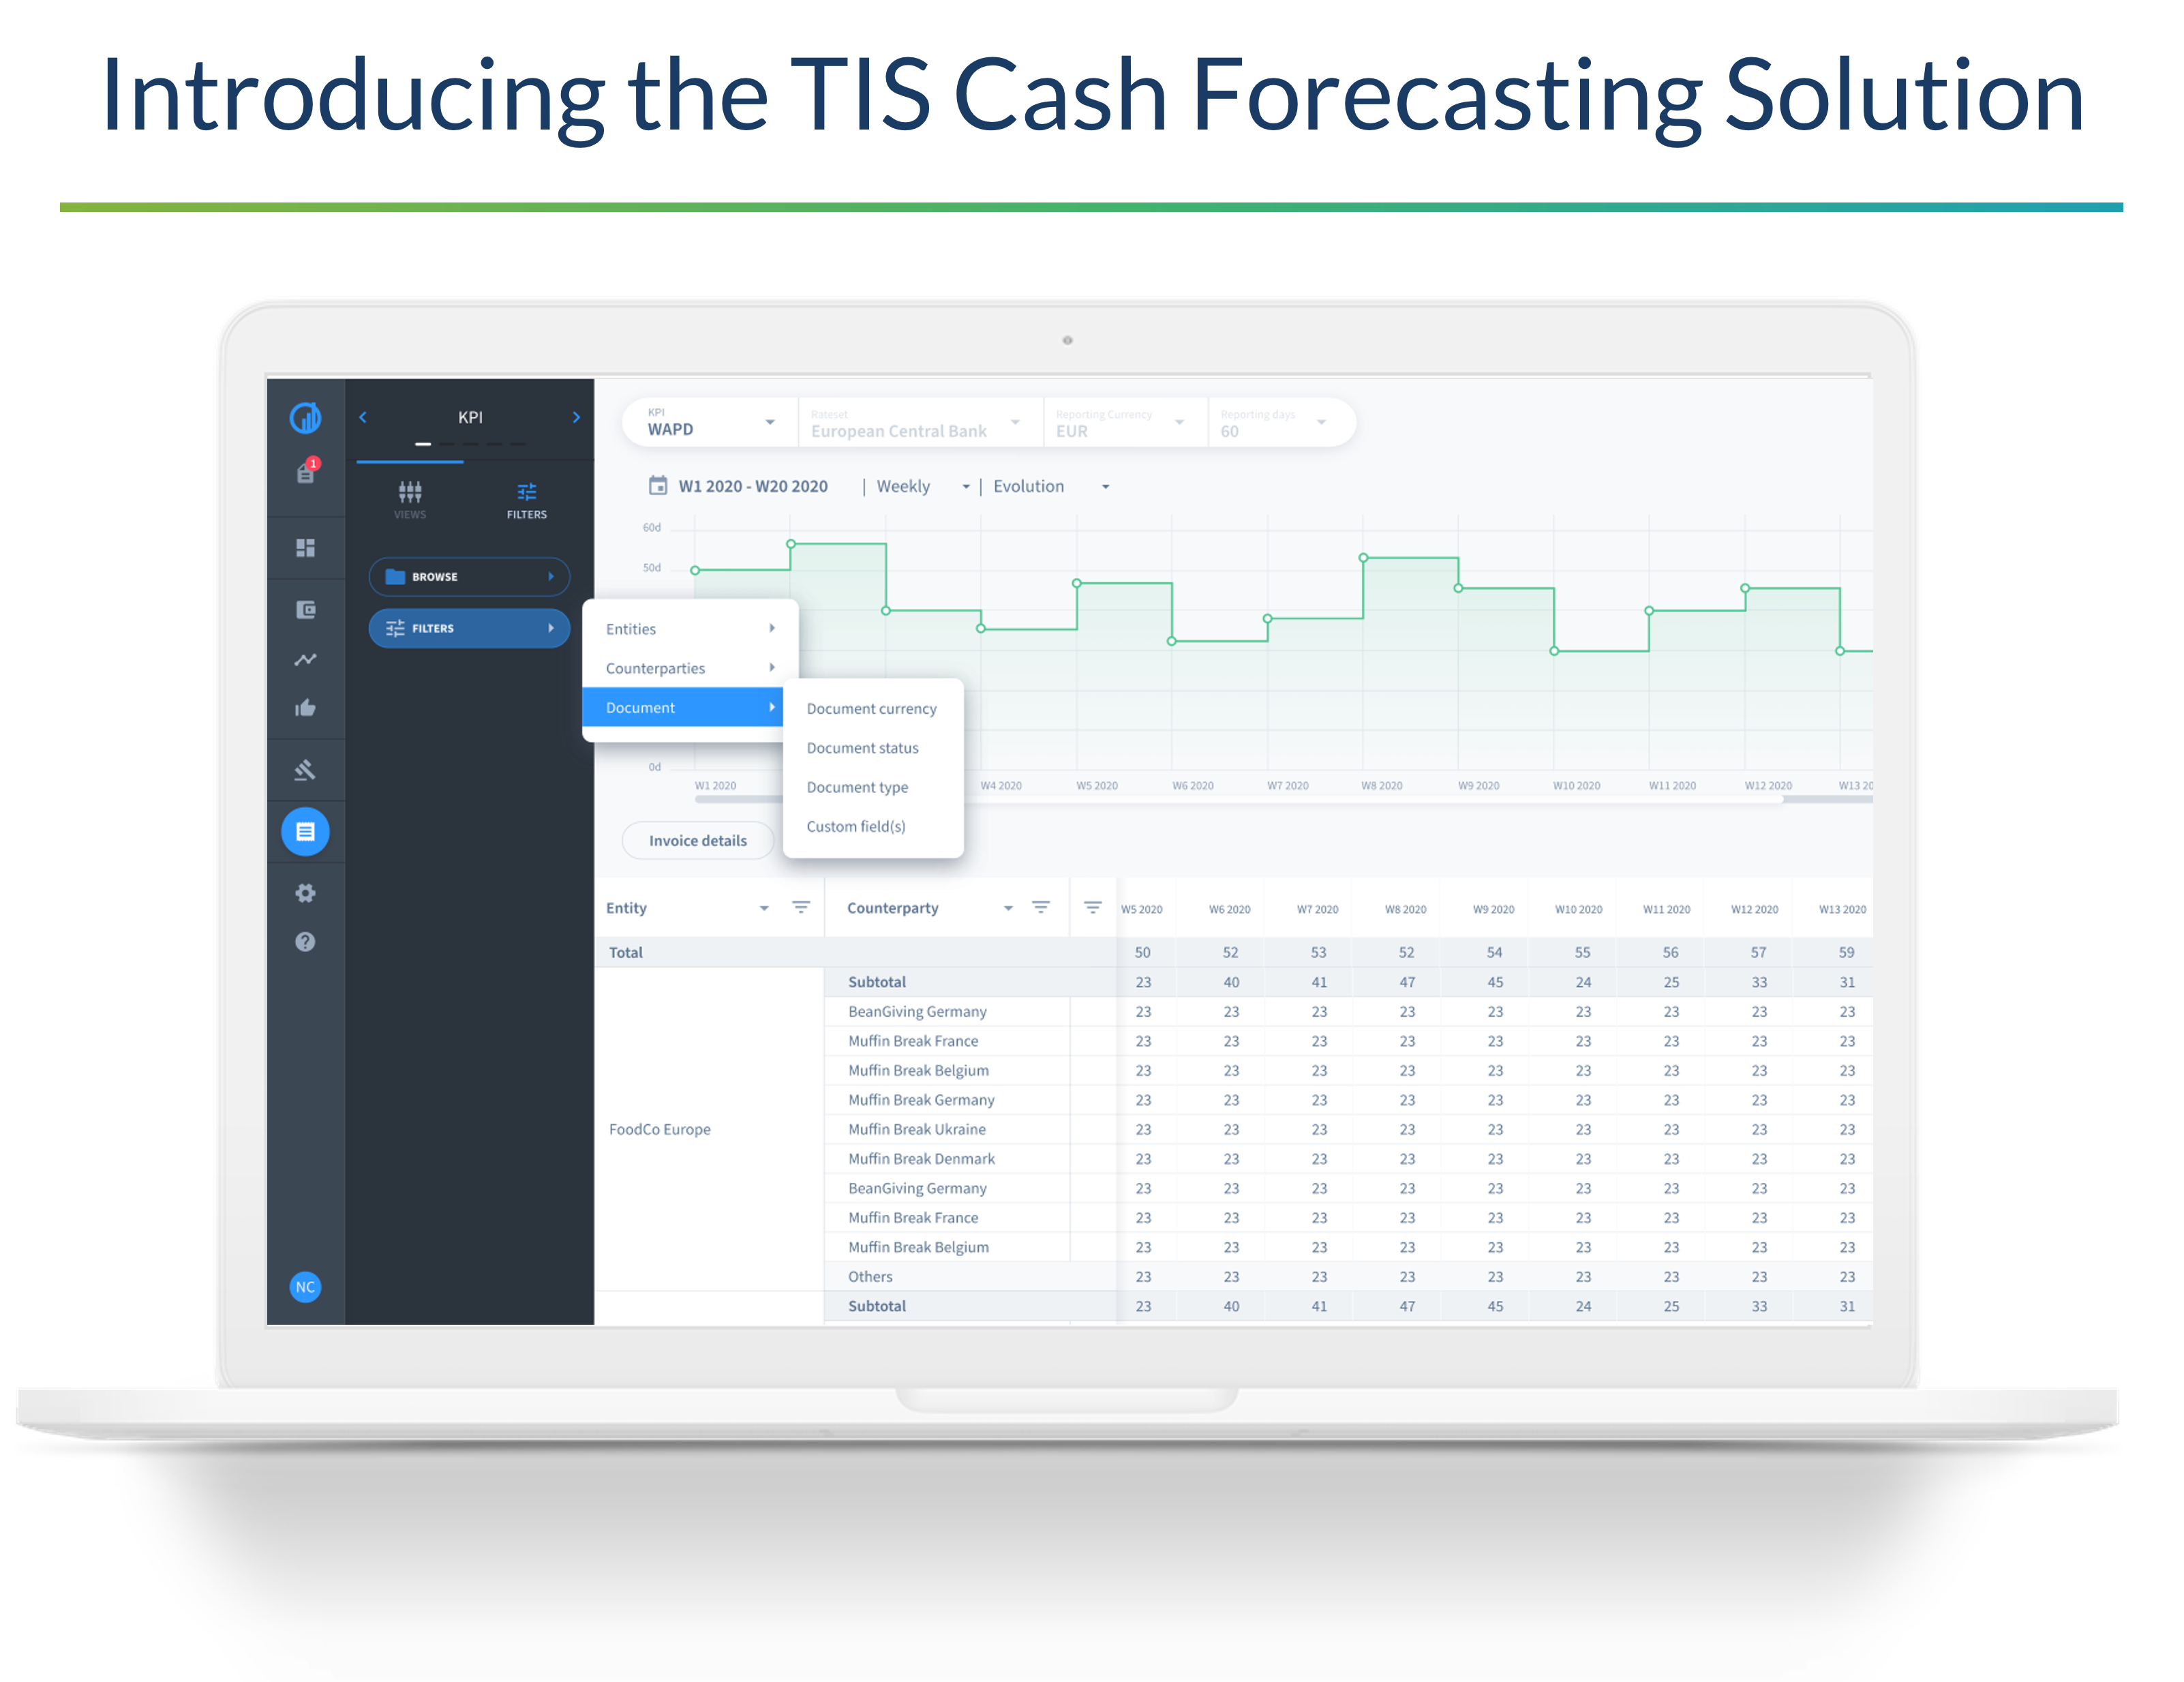
Using our tools, you can combine your global bank account balances, cash positions, and payments data with AP, supplier, procurement and sales data to create a forecast that is both comprehensive and accurate. What’s more, our advanced AI and ML tools can identify gaps and inconsistencies, leading to further improvements over time.
The benefits of these tools are manifold:
- Automating processes with our advanced cash forecasting workflows means you can save time and free up resources to focus on more strategic work.
- Our forecasting tools provide much greater accuracy compared to traditional models. As well as benefiting from our AI and ML tools, you can conduct variance and scenario analysis, compare your forecasted and actual data, and drill down into specific variables.
- Extensive working capital analytics improve the accuracy of your data inputs, while flexible dashboards enable you to access reports on any variable quickly and easily.
With all of these capabilities readily available, there’s no need to rely on spreadsheets that are not only limited and unwieldy but can actively harm your forecast. Get in touch to find out how to make spreadsheet-based forecasts a thing of the past and build a forecasting process you can be proud of.
To learn more about the cash forecast capabilities provided by TIS, download the full factsheet or contact us to request a demo!